
Solar Modulation
- ApJ 765, 91 (2013).
- ApJ 810, 142 (2015).
- Phys. Rev. Lett. 116, 241105 (2016).
- La rivista del Nuova Cimento 10, 473 (2017).
- ApJ Lett. 854, L2 (2018).
 Fig. 1 – Low energy protons as a function of kinetic energy during solar minimum, June 2006 – December 2009 (top) and during solar maximum, January 2010 – February 2014 (bottom) |
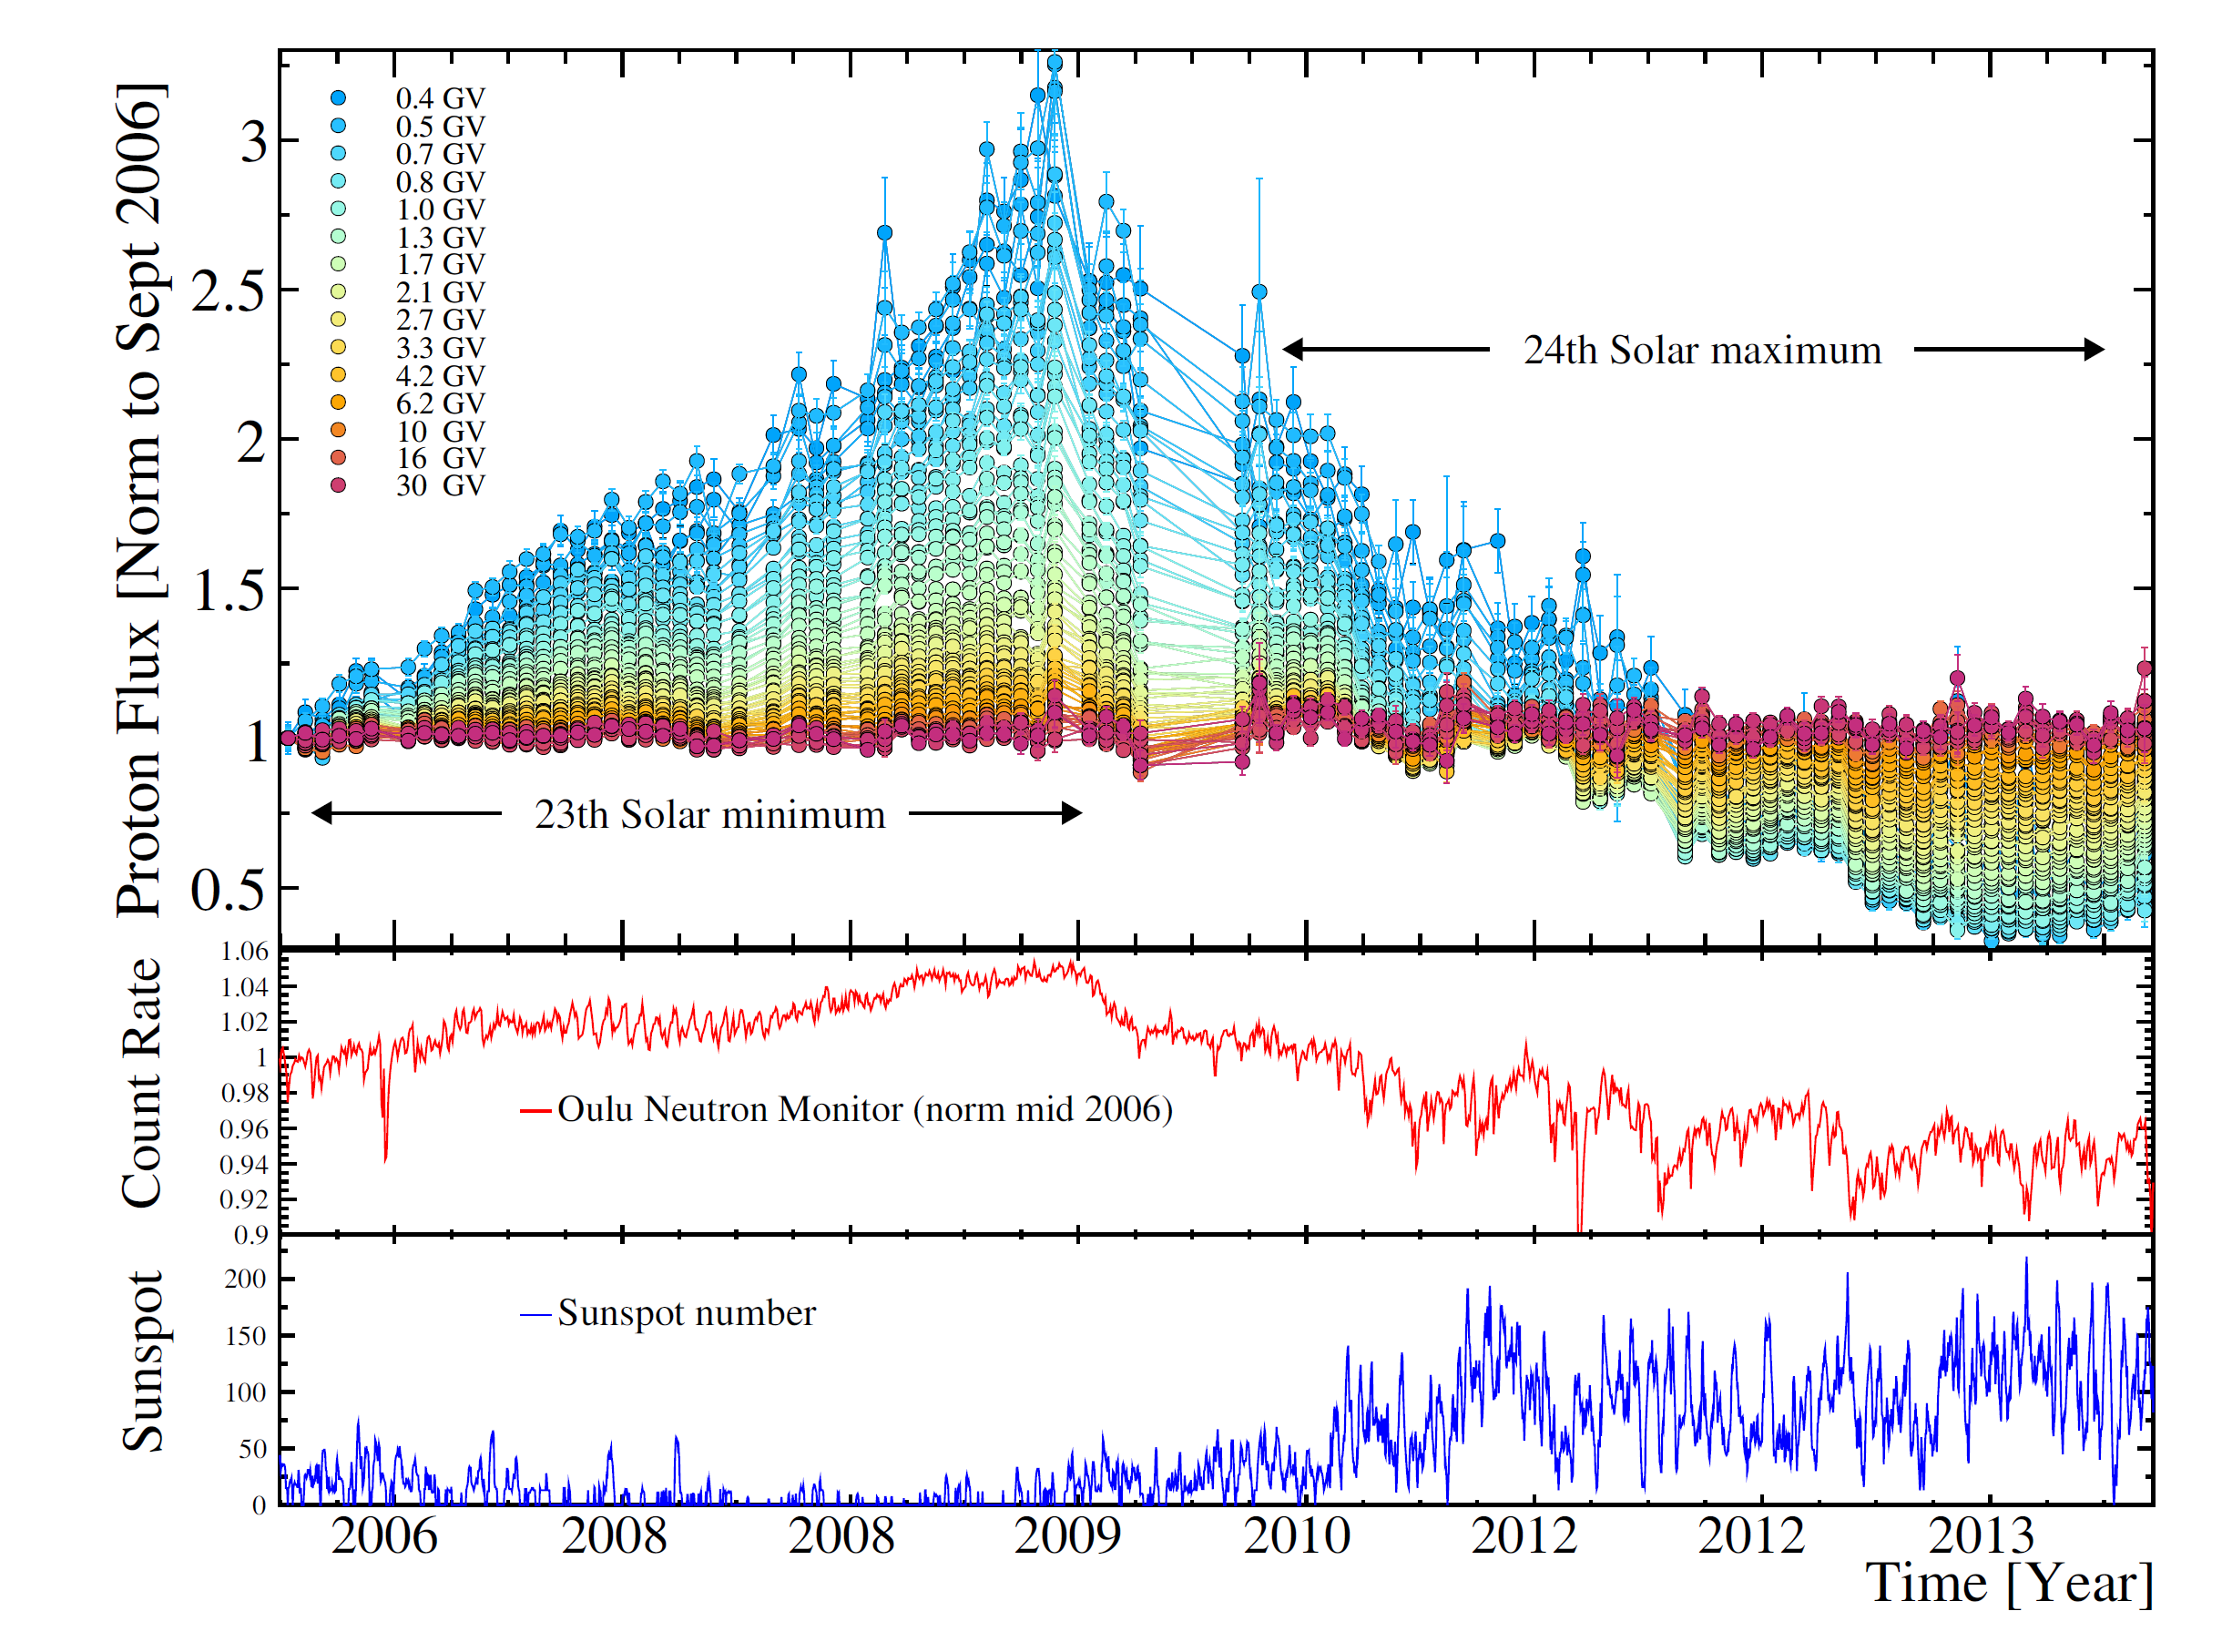 Fig. 2 – Time profiles of rigidity intervals from 0.4 GV to 30 GV, normalized to July 2006, measured between July 2006 and May 2014 |
Solar Events
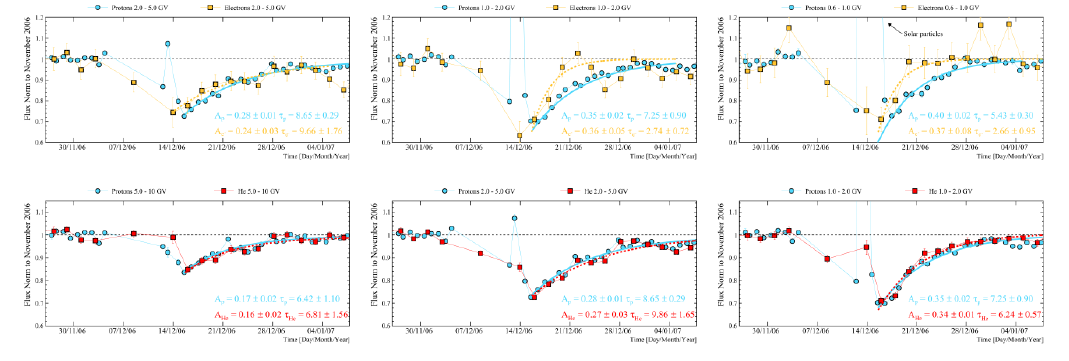 Fig. 1 – Proton (full circles), electron (full yellow squares) and helium (full red squares) time profile intensities for three different rigidity ranges during the December 2006 Forbush decrease. The proton intensity is averaged over one day while the electron and helium are averaged over two days. |
 Fig. 2 – Summary of PAMELA SEP measurements. Event-integrated fluences and peak differential spectra are shown in the top and the bottom panels, respectively. The error bars include both statistical and systematic uncertainties |